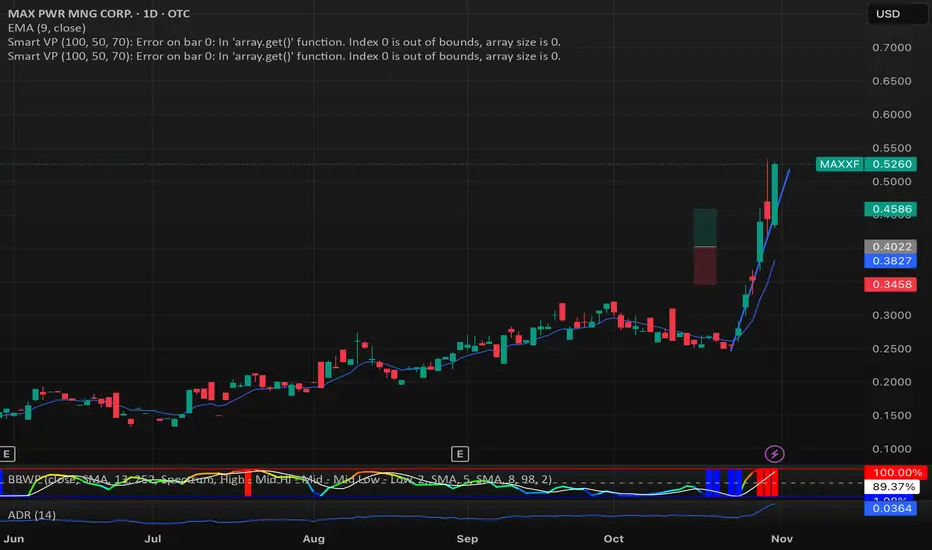
EM Visible Range Volume Profile█ OVERVIEW
ᴇᴍ VRVP (Visible Range Volume Profile) indicator calculates the volume profile within the visible range of prices.
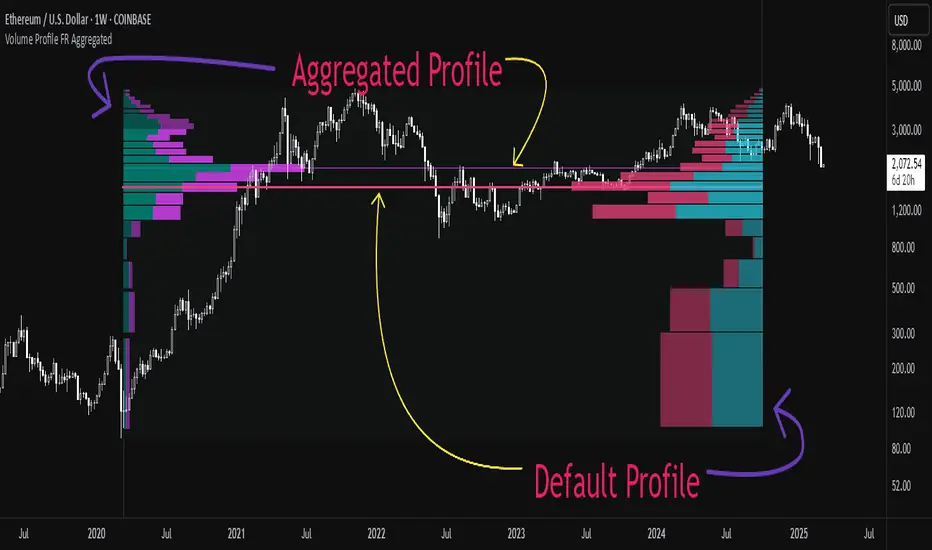
Volume Profile is an advanced technical analysis indicator that shows trading activity over a specified period of time at certain price levels.
The indicator plots a histogram on the chart that reflects dominant or significant price levels based that are based on volume.
VP concept
VP Components
Open, High, Low, Close:
There are different types of volume profile indicators but the majority of them will designate the OHLC.
Point of Control:
A price level with the most traded volume during one session, also known as POC.
High Volume Node (HVN):
Area of high volume relative to surrounding price action.
Low Volume Node (LVN):
Area of low volume relative to surrounding price action.
Analysis of price in relation to high and low volume nodes is useful when building context around your trades.
█ VOLUME PROFILE STRATEGIES
The distribution of a volume profile can help you determine the strength of a trend and spot potential reversal zones. Let’s take a look at the five different distribution types.
Neutral D
In order for price to break away from value, either the buyers or the sellers will have to become more aggressive than the other side. When this occurs, it gives us with a vital piece of information.
Now we know who were the agressors at this price level: either the buyers or the sellers. That's why this is a good level for a trading setup if the price bounces back.
Bearish P and Bullish P
Bearish P — reversal. Bullish P — confirmation.
Bearish Ь and Bullish Ь
Bearish Ь — confirmation. Bullish Ь — reversal.
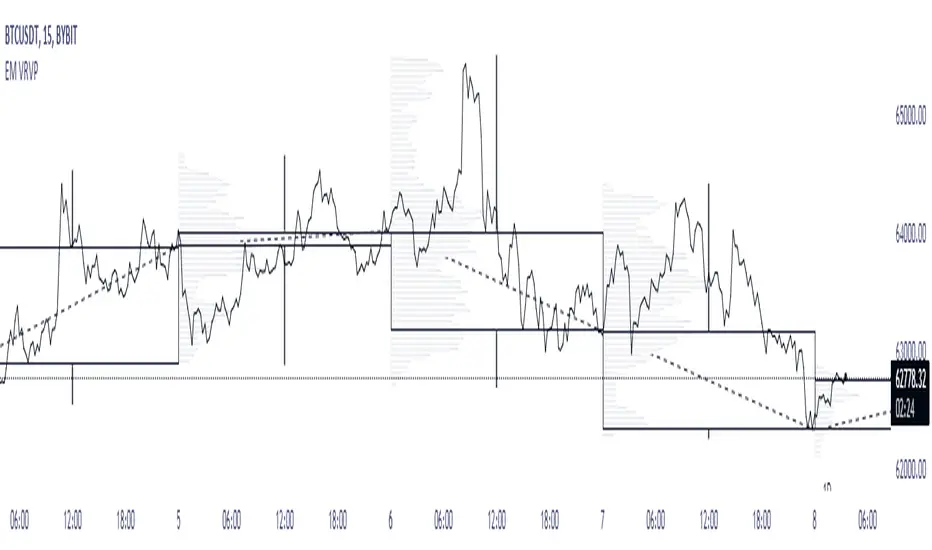
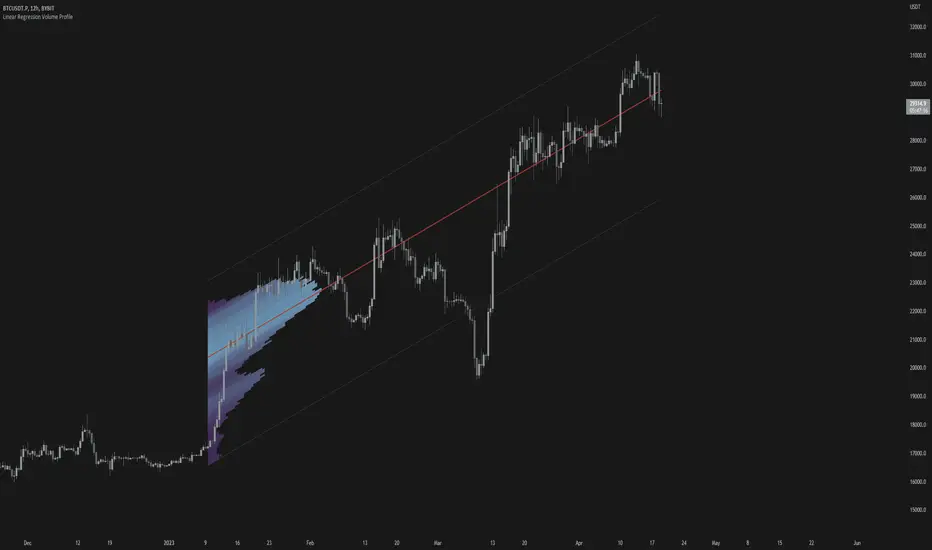
Examples
█ INPUTS
Width — amplitude of the VP histogram.
Grid — the number of columns of the VP histogram.
Delta of volumes — combinatorial determination of the ratios of sellers and buyers.
In quoted units — conversion in units of quoted currency.
Logarithmic scale — recalculation the grid step to the logarithmic scale of the chart.
HTF — (Higher Timeframe) calculation of VP for the period of the selected timeframe. ISO: Isolated computation in HTF period.
Palette: Total volume, Volume of buyers, Volume of sellers, HTF bars.
Warnings: colour of the «⚠» icon, language of information in the Tooltip.
Addition: ᴇᴍ CHN-RMA — a grid of moving averages with periods of centered hexagonal numbers.
█ ОБЩИЕ СВЕДЕНИЯ
ᴇᴍ VRVP (Visible Range Volume Profile) рассчитывает профиль объёма в видимом диапазоне цен.
Профиль объёма — это продвинутый индикатор технического анализа, который показывает торговую активность за условленный период времени на определённых ценовых уровнях.
Индикатор строит на графике гистограмму, отражающую доминирующие или значимые ценовые уровни, основанные на объёме.
█ НАСТРОЙКИ
Ширина — амплитуда гистограммы VP.
Сетка — количество колонок гистограммы VP.
Дельта объёмов — комбинаторное определение соотношений продаж и покупок.
В котируемых единицах — пересчёт в единицах котируемой валюты.
Логарифмическая шкала — пересчёт шага сетки на логарифмическую шкалу графика.
HTF — (Higher Timeframe) расчёт VP за период выбранного таймфрейма. ISO: Изолированное вычисление в HTF-периоде.
Палитра: Суммарный объём, Объём покупок, Объём продаж, Бары HTF.
Предупреждения: цвет значка «⚠», язык информации в Tooltip.
Дополнение: ᴇᴍ CHN-RMA — сетка скользящих средних с периодами центрированных гексагональных чисел.
อินดิเคเตอร์ Pine Script®